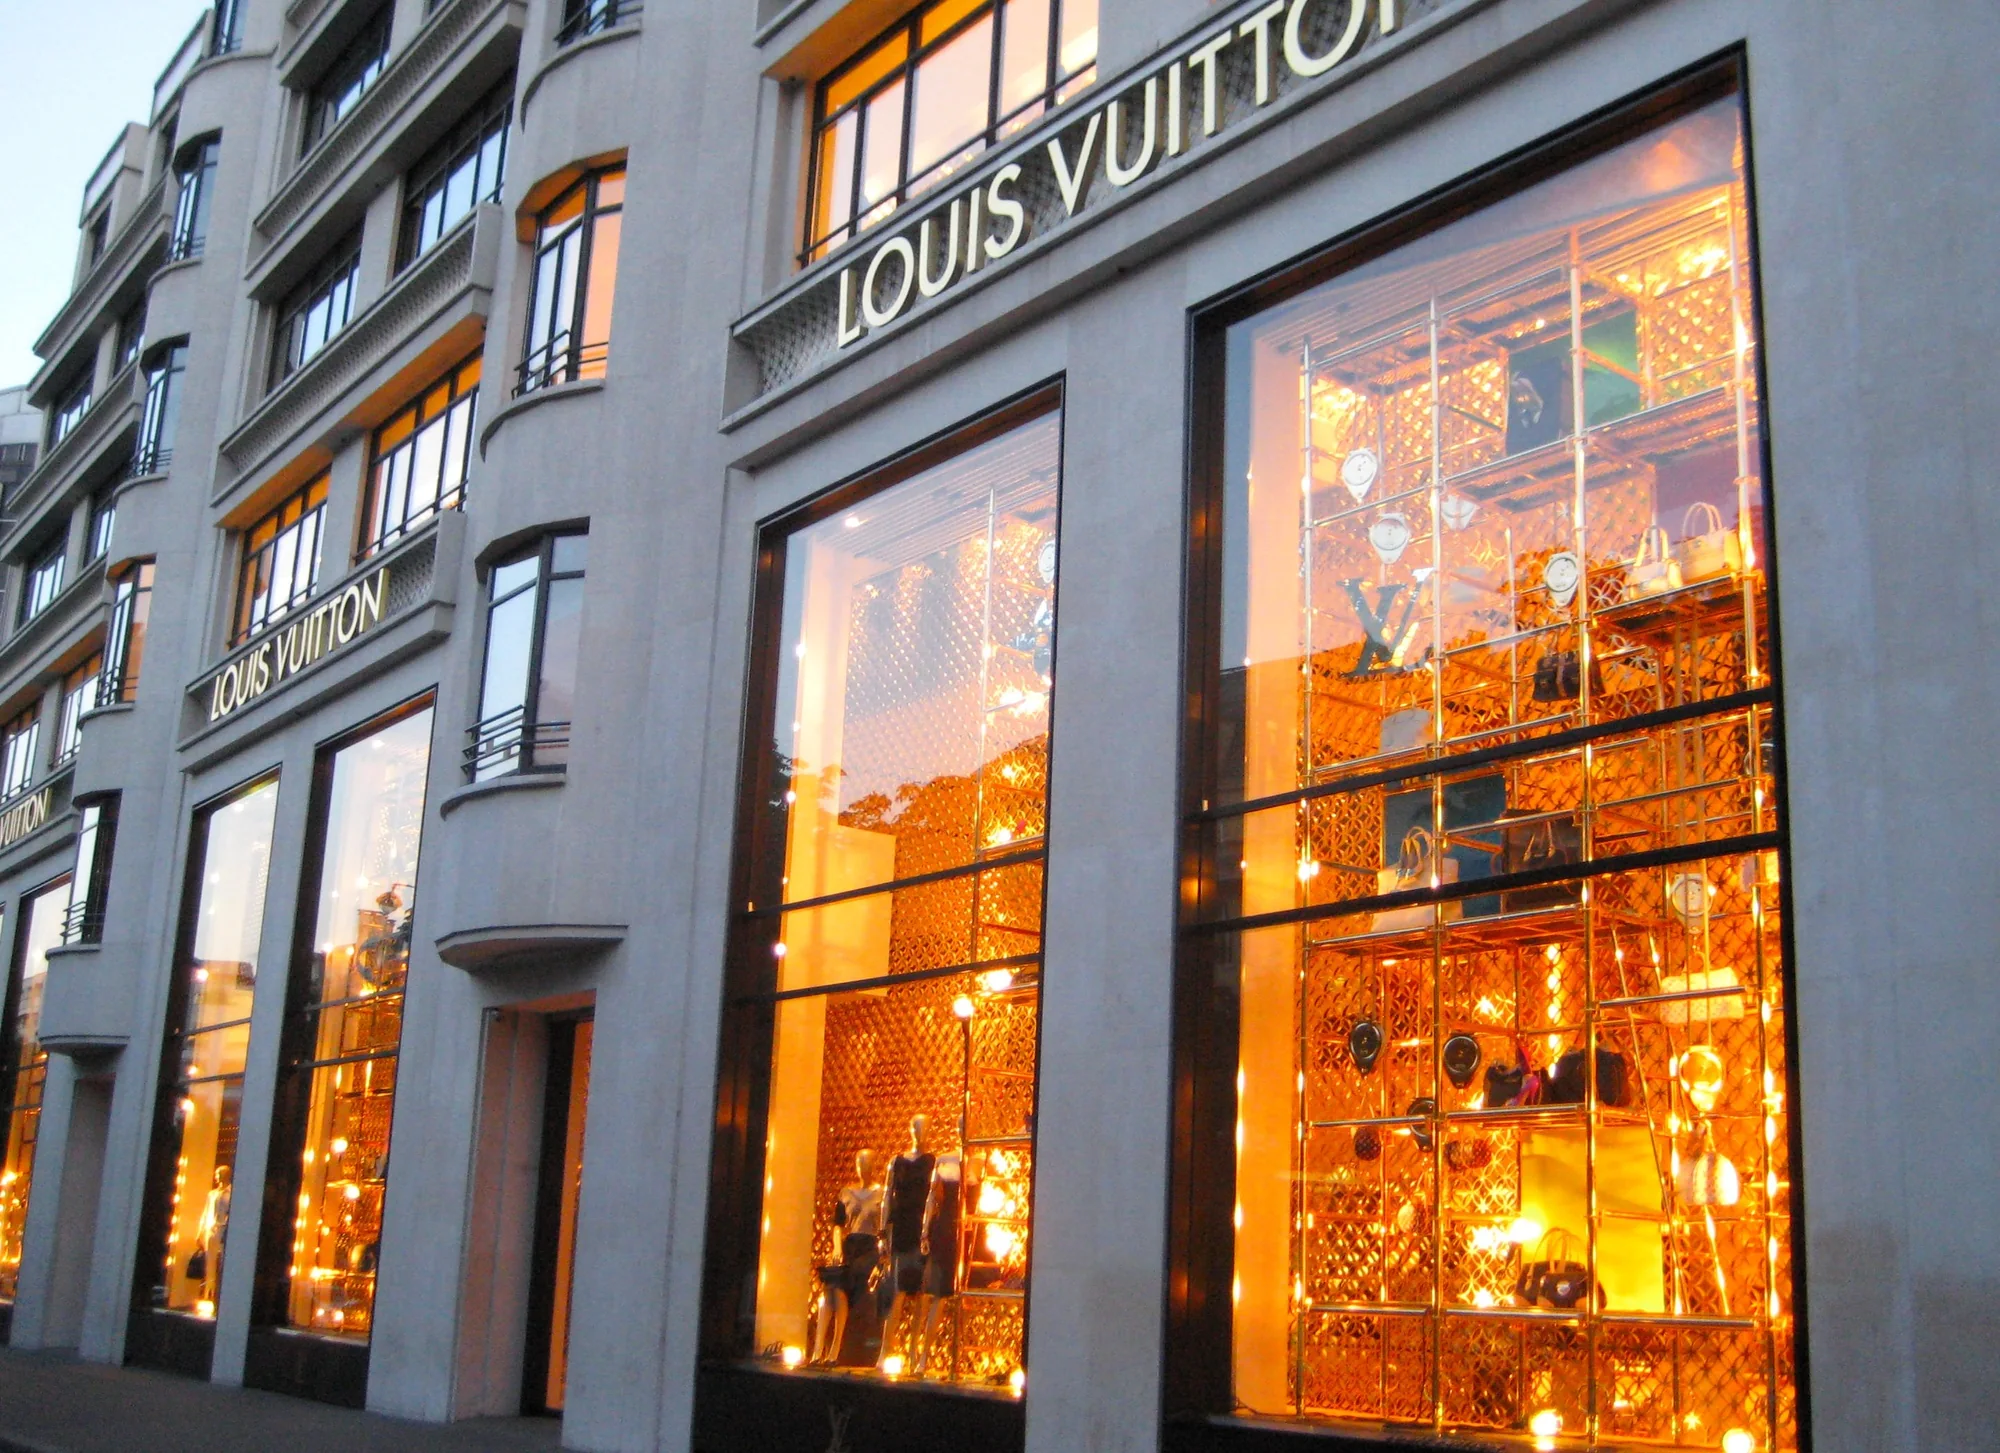
FU View
LVMH is often described as a decentralized luxury conglomerate. That is accurate but incomplete. Its deeper advantage is the placement of scale. LVMH explicitly combines autonomous Maisons with vertical integration, shared group resources, internal development and common investment in savoir-faire. FU Research interprets this as selective centralization: leverage scale in capabilities that strengthen execution, while preserving differentiation where consumers encounter product, creativity, narrative and experience. The model is powerful because a Maison can gain access to the resources of an €80.8 billion group without needing to present itself as one standardized corporate system. But the model has a hidden constraint. In 2025, Fashion & Leather Goods generated nearly three-quarters of recurring operating profit, meaning portfolio breadth does not equal economic independence from star businesses. [5]
Introduction
Luxury creates an unusual organizational problem. Conventional businesses often use scale to standardize: shared procurement, common processes, unified systems and repeated customer experiences can reduce cost and improve consistency. Luxury depends on almost the opposite perception. A Maison must feel culturally specific, creatively intentional and difficult to substitute.
LVMH has to satisfy both conditions simultaneously. It now encompasses more than 75 Maisons and over 6,280 stores, while its stated mission is to support the development of each Maison without sacrificing its identity, heritage or expertise. Its model explicitly says that resource sharing should respect the identity and independence of individual Maisons. [6]
That creates the central paradox of this research:
“A conglomerate benefits from becoming more coordinated. A luxury portfolio can lose value if customers begin to perceive that coordination.”
The strategic question is therefore not whether LVMH is centralized or decentralized. It is where centralization stops.
Business and Financial Context
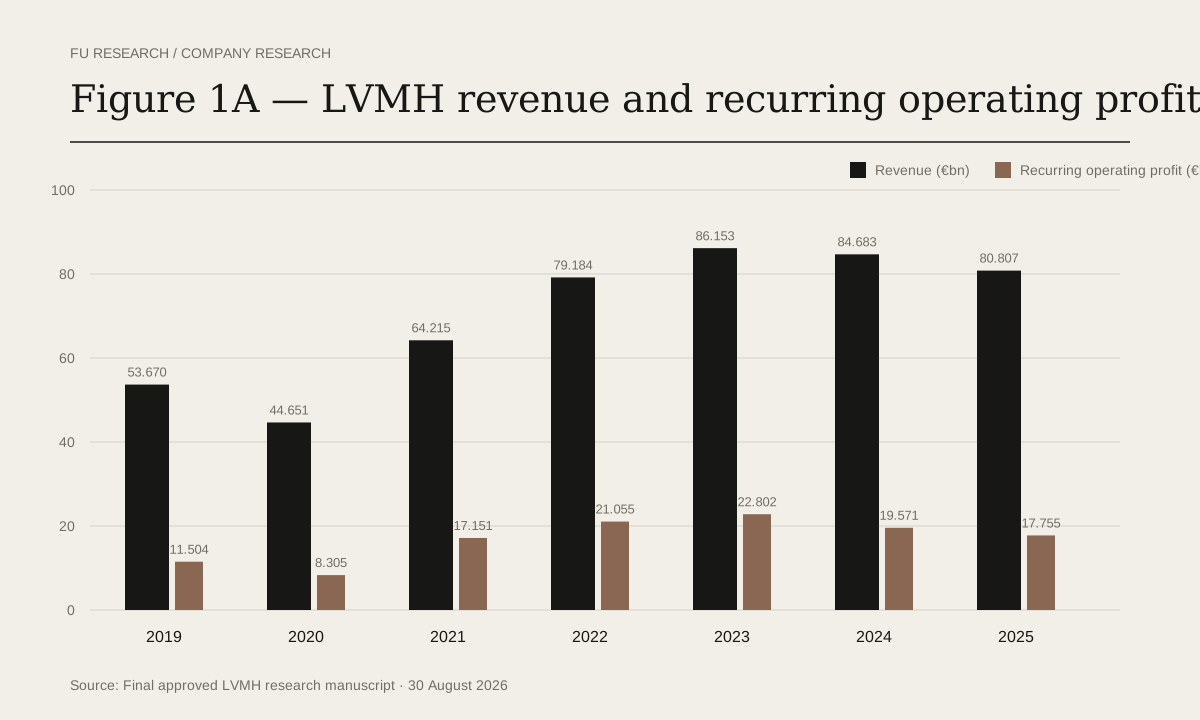
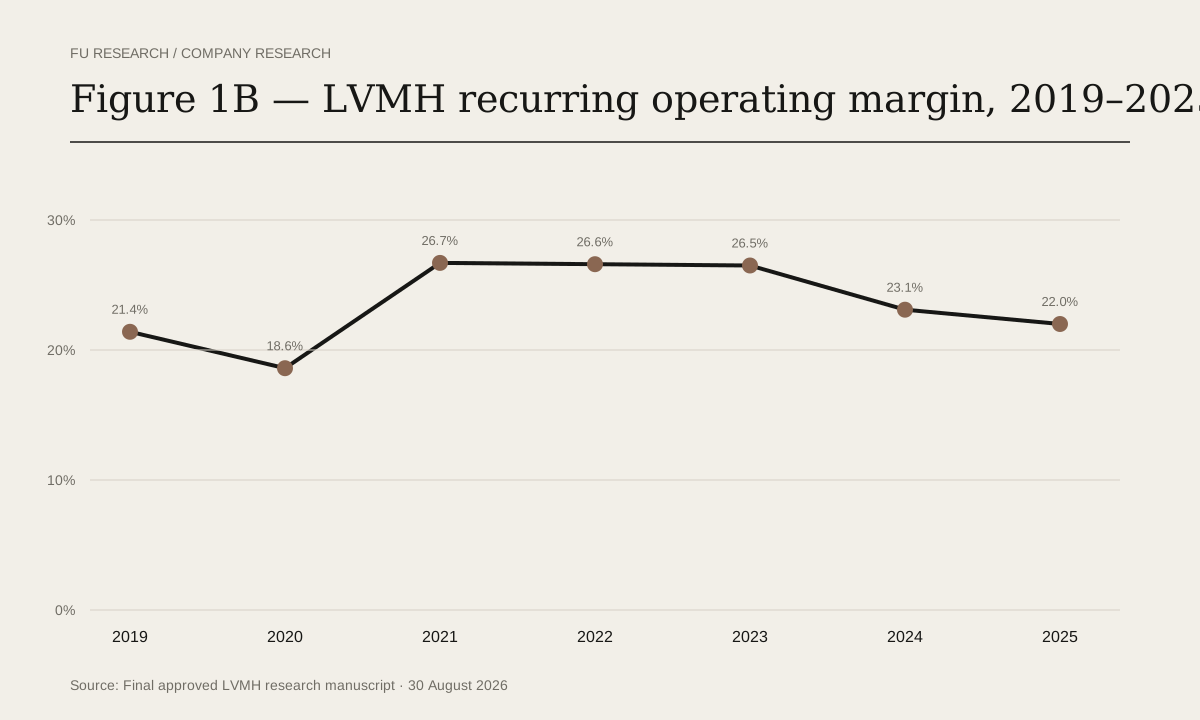
LVMH entered the post-pandemic period from a position of extraordinary expansion. Revenue rose from €53.7 billion in 2019 to €86.2 billion in 2023 before declining to €84.7 billion in 2024 and €80.8 billion in 2025. Profit from recurring operations moved from €11.5 billion in 2019 to €22.8 billion in 2023, then fell to €17.8 billion by 2025. The resulting recurring operating margin rose from roughly 21.4% in 2019 to around 26.5%–26.7% during 2021–2023 before normalizing to 22.0% in 2025. [7]
| Year | Revenue (€bn) | Profit from recurring operations (€bn) | Recurring operating margin |
|---|---|---|---|
| 2019 | 53.670 | 11.504 | 21.4% |
| 2020 | 44.651 | 8.305 | 18.6% |
| 2021 | 64.215 | 17.151 | 26.7% |
| 2022 | 79.184 | 21.055 | 26.6% |
| 2023 | 86.153 | 22.802 | 26.5% |
| 2024 | 84.683 | 19.571 | 23.1% |
| 2025 | 80.807 | 17.755 | 22.0% |
Source: LVMH annual-result disclosures. Margins are recurring operating profit divided by revenue and rounded to one decimal; reported figures agree with LVMH’s published margins where stated. [8]
LVMH revenue and recurring operating profit, 2019–2025
Bar chart comparing LVMH revenue and profit from recurring operations from 2019 to 2025, in billions of euros.
LVMH recurring operating margin, 2019–2025
Line chart of LVMH recurring operating margin from 2019 to 2025.
The period should not be interpreted as evidence that the model stopped working. The luxury market itself weakened: Bain estimates personal luxury goods declined around 2% at current exchange rates to €364 billion in 2024 and again to approximately €358 billion in 2025; it also identified continued contraction in the luxury consumer base and pressure from elevated pricing and macroeconomic uncertainty. LVMH additionally reported significant unfavorable currency effects on 2024 and 2025 profitability. [9]
By the first half of 2026, there were signs of stabilization. LVMH reported €38.6 billion of revenue, 2% organic growth, recurring operating profit of €8.7 billion and a 22.5% margin. Fashion & Leather Goods returned to positive organic growth in the second quarter, while Tiffany and Bvlgari performed strongly and Sephora continued growing. These figures do not prove the architecture creates resilience, but they weaken the argument that the 2024–2025 decline alone represents structural failure. [10]
The more revealing figure is concentration inside the portfolio.
| 2025 business group | Revenue (€m) | Revenue share | Recurring operating profit (€m) | Profit share | Segment margin |
|---|---|---|---|---|---|
| Wines & Spirits | 5,358 | 6.6% | 1,016 | 5.7% | 19.0% |
| Fashion & Leather Goods | 37,770 | 46.7% | 13,209 | 74.4% | 35.0% |
| Perfumes & Cosmetics | 8,174 | 10.1% | 727 | 4.1% | 8.9% |
| Watches & Jewelry | 10,486 | 13.0% | 1,514 | 8.5% | 14.4% |
| Selective Retailing | 18,348 | 22.7% | 1,780 | 10.0% | 9.7% |
| Other & eliminations | 671 | 0.8% | -491 | -2.8% | — |
| LVMH | 80,807 | 100% | 17,755 | 100% | 22.0% |
FU Research calculations from LVMH’s 2025 disclosed segment results. [11]
LVMH 2025 segment revenue share vs recurring operating profit share
Horizontal bar comparison of LVMH 2025 segment revenue share and recurring operating profit share.
The implication is important: LVMH is diversified in activity more than it is diversified in economic value creation. Fashion & Leather Goods supplied less than half of revenue but almost three-quarters of recurring operating profit in 2025. The group therefore cannot treat its strongest fashion Maisons as simply one category among many. Protecting their distinctiveness is economically disproportionate to their revenue weight. [4]
How the Strategy Works
LVMH formally describes six relevant elements of its model: decentralization, internal growth, vertical integration, group-level synergies, preservation of savoir-faire and innovation. It says individual Maisons are autonomous and reactive, while resources can be shared at group scale as long as Maison identity and independence are respected. Vertical integration extends from sourcing through manufacturing and selective distribution. [2]
The strategic interpretation is not “everything backstage is centralized.” LVMH does not disclose such a structure, and many production capabilities remain deeply Maison-specific. A better interpretation is decoupling: some capabilities can gain scale or group support without requiring the brands that use them to become visibly similar.
Selective Centralization
Group-level leverage
- Investment capacity
- Selected infrastructure
- Expertise
- Talent development
- Selected sourcing / production capabilities
- Technology
- Best-practice sharing
- Selected vertical integration
Maison-level differentiation
- Creative direction
- Product expression
- Brand narrative
- Customer experience
- Heritage
- Taste
- Maison identity
The model does not assume that everything backstage is centralized or everything customer-facing is decentralized. Production, craftsmanship and operational capabilities may themselves remain Maison-specific.
Decentralize what defines identity. LVMH explicitly states that autonomy helps Maisons remain close to customers and preserve entrepreneurial energy, while its mission stresses the distinctive identity and heritage of each Maison. FU Research therefore treats product direction, brand narrative, creative expression and the character of customer-facing experiences as the layer in which differentiation is most strategically sensitive. [12]

Leverage scale where it increases capability. LVMH says it shares resources across the group, vertically manages parts of the value chain and invests in common systems for preserving craftsmanship. By year-end 2025, the group employed more than 211,000 people, operated 117 production facilities and craft workshops in France alone, and had trained more than 3,800 apprentices through its Institut des Métiers d’Excellence since 2014. These are capabilities that a small independent Maison would have difficulty reproducing at equivalent breadth. [13]

Use the portfolio as an investment platform. LVMH generated €11.3 billion of operating free cash flow in 2025 and reduced net financial debt by 26% to €6.9 billion. That financial scale creates the capacity to invest through downturns, although the internal process by which capital is allocated among individual Maisons is not publicly disclosed. The strategic advantage here is therefore best described as investment capacity, not proven superior capital allocation. [4]
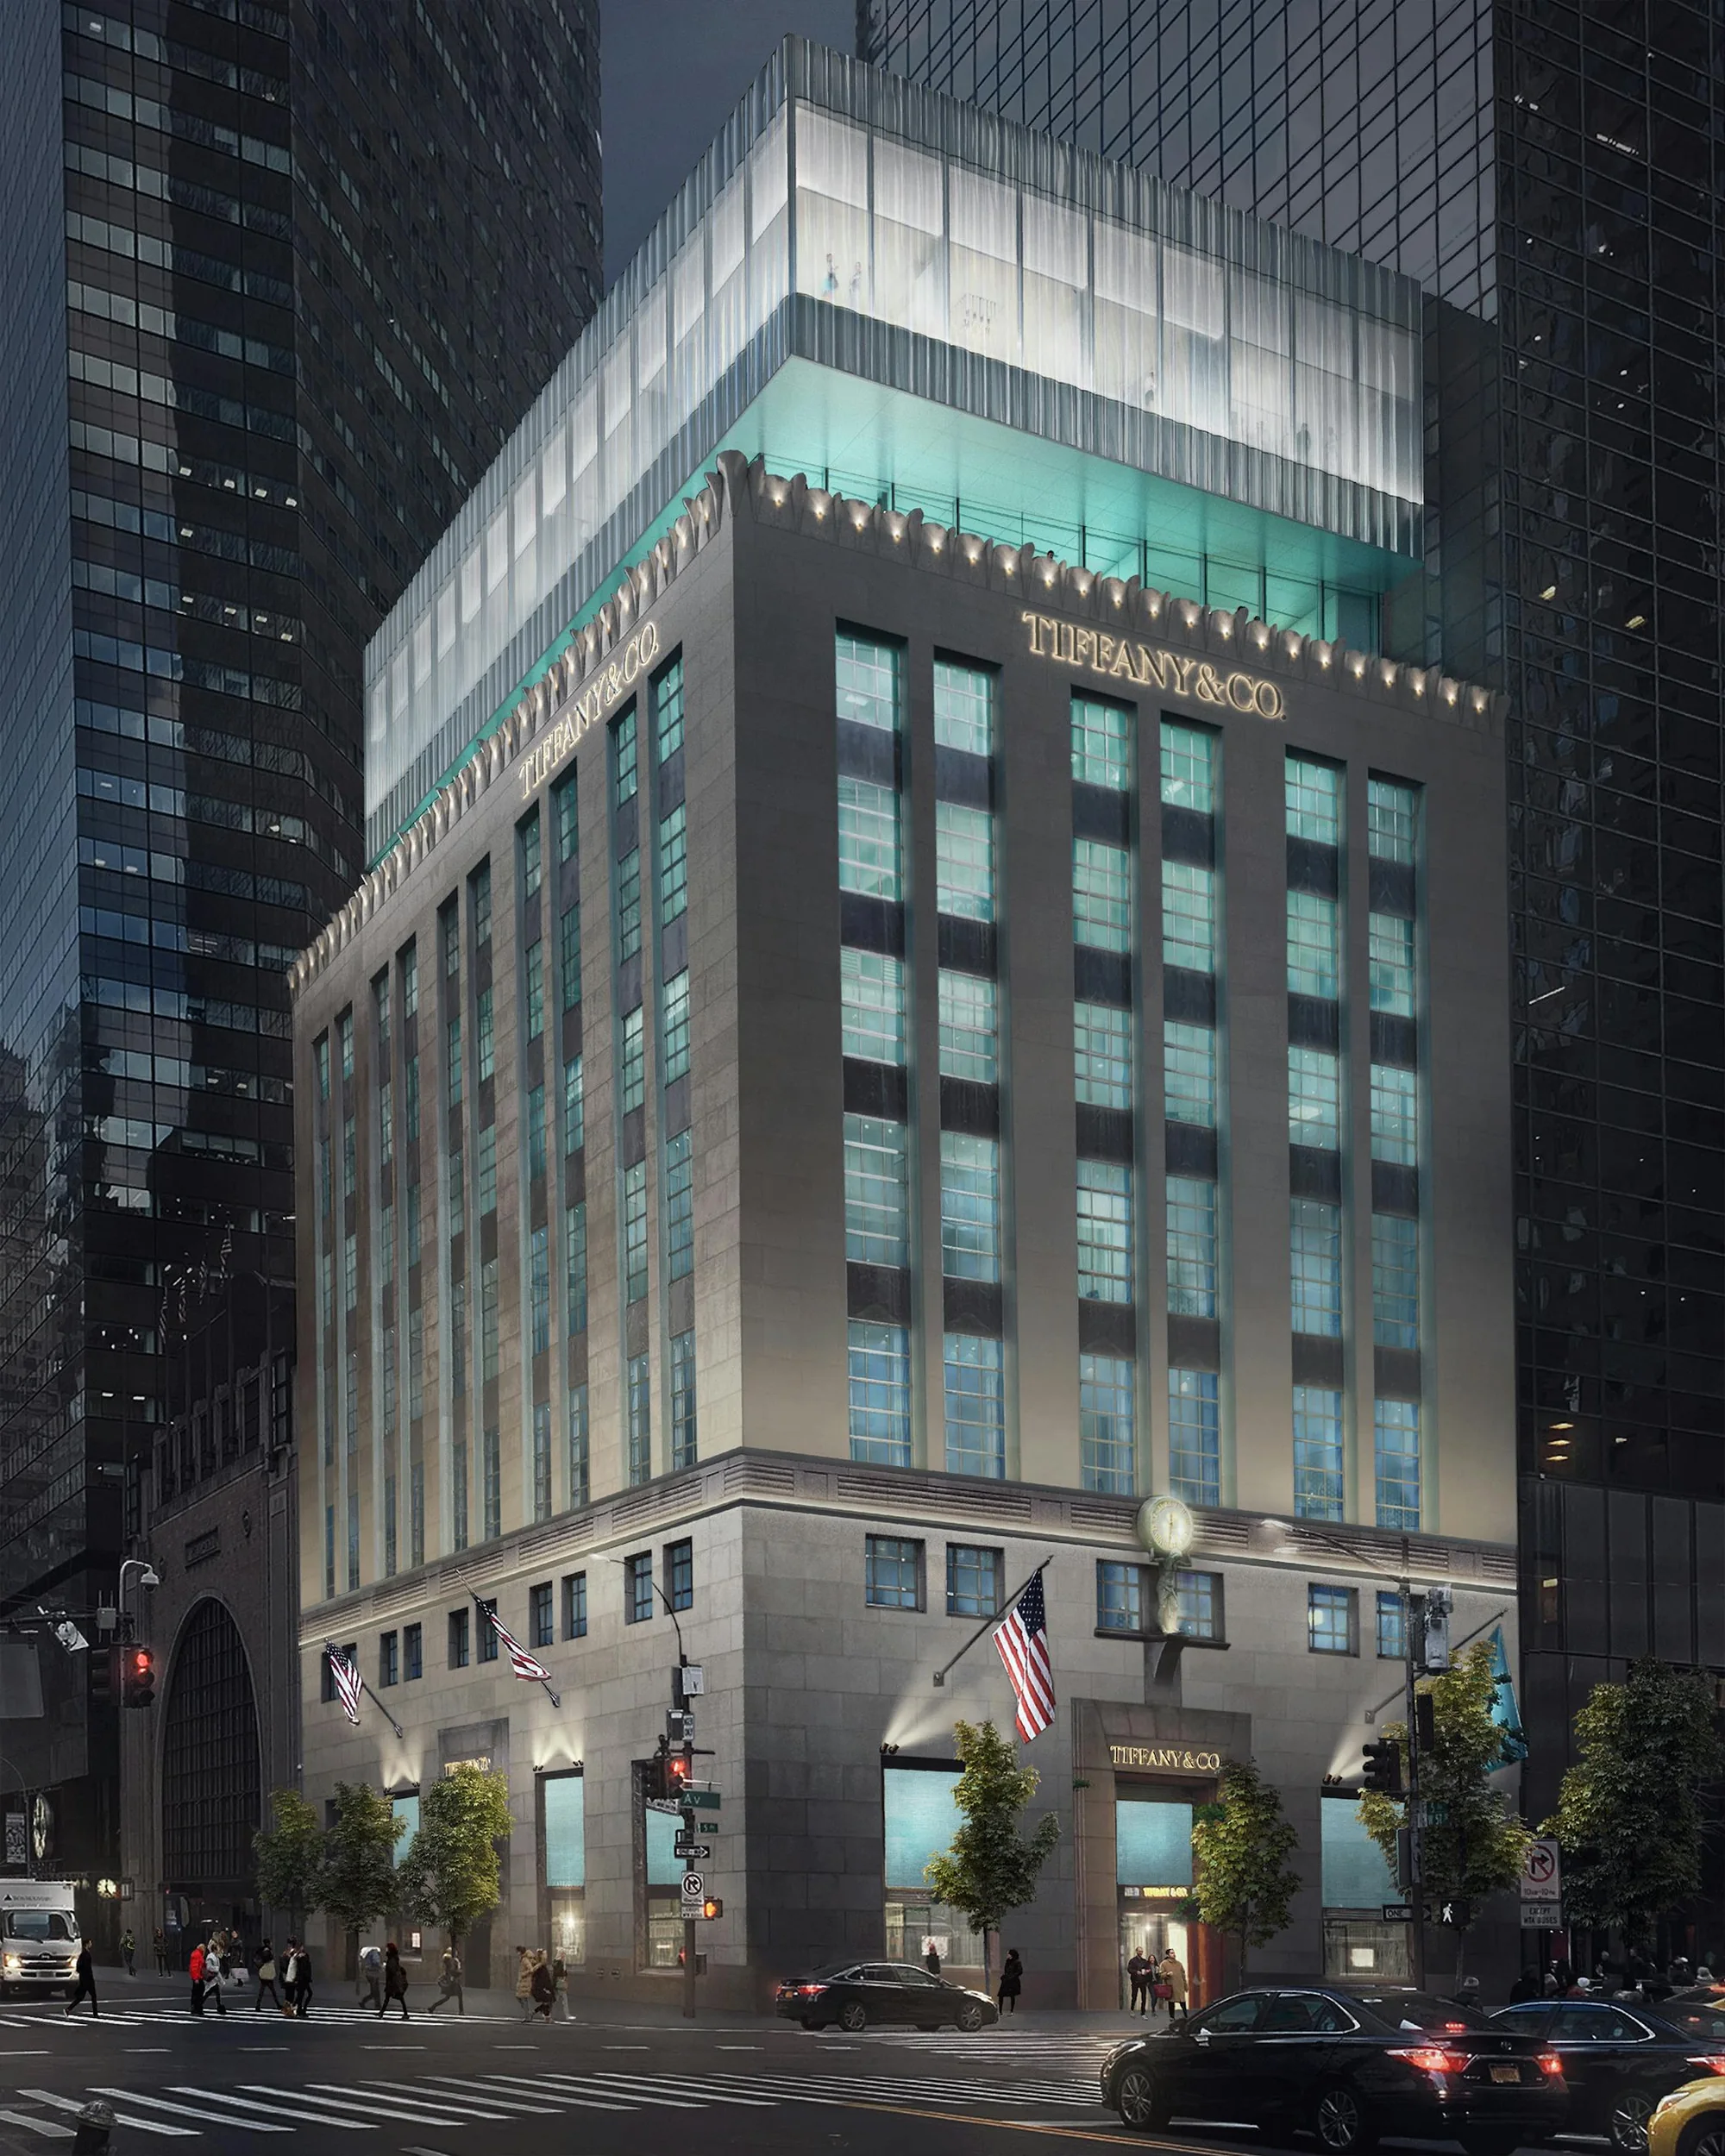
Tiffany illustrates what this can look like after acquisition. LVMH first consolidated Tiffany in 2021 and reported record Tiffany revenue, profit and cash flow during its first year inside the group. Since then it has invested heavily in product lines and retail environments; by 2025 LVMH reported continued strength in Tiffany’s HardWear, Knot and Bird on a Rock collections and ongoing renovation of the store network. [14]
Sephora shows a different version of scale. It now operates in 35 markets through more than 3,000 stores and digital channels. In 2025, LVMH said Sephora continued growing both revenue and profit, gained market share in multiple countries and opened roughly 100 stores; Selective Retailing’s recurring operating profit increased 28%. [15]
These cases matter because LVMH is not applying one operating formula to everything it owns. Tiffany is a high-end jewelry Maison whose identity is itself an asset. Sephora is a scaled beauty retail platform where repeatable omnichannel systems can be more visible without destroying the proposition. The appropriate degree of standardization depends on where differentiation actually lives.
Competitive Advantage, Evidence and Counterarguments
LVMH’s architecture can create competitive advantage through three mechanisms.
First, it separates ownership from sameness. More than 75 brands can sit under one owner without one corporate brand becoming the primary customer proposition. This is particularly valuable in luxury because a customer buying Dior, Louis Vuitton, Tiffany or Loro Piana is not primarily buying “LVMH.” The group can remain economically large while its Maisons remain culturally narrower. LVMH’s own operating philosophy explicitly prioritizes Maison autonomy and independent identity. [6]
Second, scale can improve control rather than merely efficiency. LVMH’s model emphasizes vertical integration from raw-material sourcing through manufacturing and selective retailing. That matters because luxury economics depend not only on manufacturing cost but also on controlling quality, scarcity, distribution and how products are presented. [2]
Third, size creates strategic endurance. In 2020, when the pandemic caused group revenue to fall 17%, Fashion & Leather Goods revenue fell only 5% on a reported basis and its recurring operating profit declined just 2%. LVMH also chose to limit promotions and parallel-market distribution in Perfumes & Cosmetics despite short-term pressure, explicitly citing the medium-term risk to brand desirability. That episode is evidence of willingness to protect positioning rather than maximize immediate volume. [16]
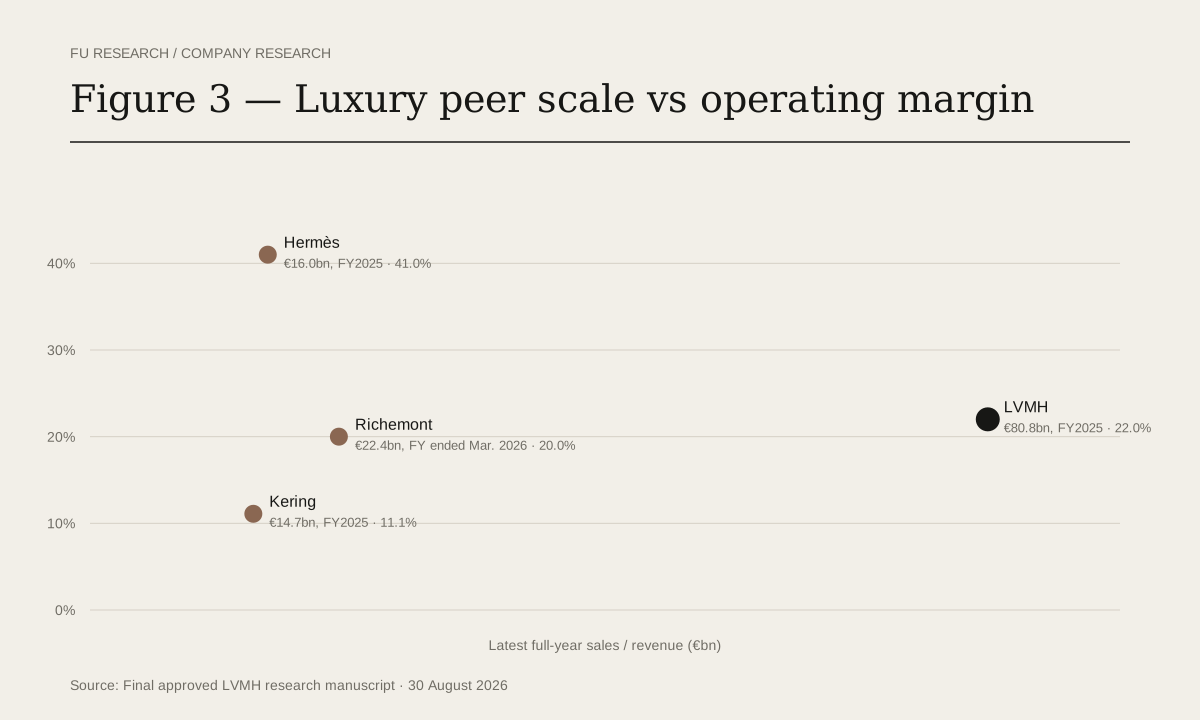
The peer comparison shows why neither scale nor concentration alone explains luxury performance.
| Company | Latest full-year sales/revenue | Operating / recurring operating margin | Concentration proxy |
|---|---|---|---|
| LVMH | €80.8bn, FY2025 | 22.0% | Fashion & Leather Goods = 46.7% of revenue; 74.4% of recurring operating profit |
| Kering | €14.7bn, FY2025 | 11.1% | Gucci ≈ 40.9% of revenue |
| Richemont | €22.4bn, FY ended Mar. 2026 | 20.0% | Jewellery Maisons ≈ 73.6% of sales |
| Hermès | €16.0bn, FY2025 | 41.0% | No directly comparable flagship-brand revenue share is disclosed; reporting is primarily by métier |
LVMH data are from its FY2025 disclosures. Kering reported €14.675 billion of 2025 revenue, an 11.1% recurring operating margin and €6.0 billion of Gucci revenue. Richemont reported €22.42 billion of FY2026 sales, a 20.0% operating margin and €16.5 billion from Jewellery Maisons. Hermès reported €16.002 billion of 2025 revenue and a 41.0% recurring operating margin. The concentration measures are not perfectly comparable because each company discloses its portfolio differently; they should be read as structural proxies rather than standardized accounting measures. [17]
Luxury peer scale vs operating margin
Scatter chart comparing latest full-year luxury peer revenue and operating or recurring operating margin.
This produces the first major counterargument: perhaps LVMH succeeds not because its architecture is unusually effective, but because it owns exceptional assets. LVMH does not publish standalone Louis Vuitton or Dior profit figures. It disclosed in 2022 that Louis Vuitton alone exceeded €20 billion of revenue, and the 2025 segment data demonstrate extraordinary dependence on Fashion & Leather Goods profitability. It is therefore impossible from public data to isolate how much value comes from the conglomerate architecture versus the inherent strength of its largest Maisons. [18]
A second counterargument concerns causality. LVMH’s descriptions of autonomy and synergy are company statements. Strong Tiffany performance after integration is consistent with group value creation, but Tiffany’s detailed standalone financial statements are no longer disclosed in a way that allows an external researcher to construct a clean counterfactual. The correct conclusion is not “LVMH caused Tiffany’s success”; it is that Tiffany provides evidence consistent with the hypothesis that a Maison can accept large-scale investment without losing its distinct identity. [19]
A third counterargument comes from Hermès. Hermès generated a 41.0% recurring operating margin in 2025—far above LVMH’s 22.0% group margin—without relying on LVMH’s level of conglomerate breadth. Scale across many brands is therefore clearly not required to create outstanding luxury economics. [20]
That is precisely why the LVMH thesis must remain narrow: the conglomerate structure is an advantage only when it increases capability without reducing the differentiated value of the underlying Maisons.
Trade-offs, Strategic Implications and Original Insight
The model contains an unavoidable trade-off. Every shared capability potentially creates efficiency, knowledge or bargaining power—but every shared rule also creates a possibility that brands begin behaving alike.
LVMH has not publicly reached a definable “breaking point,” and the 2024–2025 decline should not be treated as evidence that it has. The luxury market weakened at the same time, currencies were unfavorable, and LVMH returned to organic growth in the second half of 2025 and first half of 2026. [21]
Instead, the breaking point should be defined operationally:
“Scale stops being an advantage when the customer-visible similarity created by coordination becomes greater than the capability advantage created by sharing.”
That leads to the FU Visibility Rule.
Where should coordination stop?
- Question 1
Does this decision directly shape what customers see or feel?
If “yes”…→ Identity is exposed
Default decision→ Decentralize - Question 2
Does its value depend heavily on Maison-specific heritage or taste?
If “yes”…→ Standardization risks substitution
Default decision→ Decentralize - Question 3
Can scale improve capability without making brands appear more similar?
If “yes”…→ Group leverage is available
Default decision→ Share / centralize selectively - Question 4
Is the capability largely invisible to customers?
If “yes”…→ Identity risk is lower
Default decision→ Test group-level coordination - Question 5
Can common infrastructure support different executions?
If “yes”…→ Best of both models is possible
Default decision→ Centralize infrastructure, decentralize expression
The Visibility Rule is an FU Research analytical interpretation developed from the evidence examined. It is not presented as LVMH’s disclosed internal decision-rights framework.
The rule is not “centralize backstage, decentralize frontstage” in an absolute sense. Craftsmanship and production can be highly identity-specific, while some customer-facing technology may rationally use common infrastructure. The important variable is whether scale forces the expression of different brands to converge.
Original Insight — The Correlation Warning
The most useful new conclusion from this research is that managers may be measuring the wrong thing when they worry about over-centralization.
Public discussions of LVMH already describe the tension between decentralization, brand autonomy, vertical integration and group synergies; that idea is not new. Historical and academic discussions likewise examine how LVMH combines scale economies with a decentralized organization. [22]
What I did not find in the public material reviewed for this research is a framework that treats rising cross-brand customer-visible correlation as an explicit leading indicator of excessive centralization. This cannot establish that nobody has ever proposed a similar concept, so the responsible claim is that this is an original FU Research synthesis, not proven universal novelty.
The idea is simple:
The Correlation Warning
Do not measure over-centralization by how much the parent company shares. Measure it by how similarly supposedly different brands begin to behave.
Call this the Correlation Warning.
A multi-brand company could create a quarterly Visible Correlation Score across four observable dimensions:
Are different brands raising prices at increasingly similar times and rates?
Are launch calendars and category expansions becoming synchronized?
Are campaigns, celebrities, events and cultural partnerships becoming structurally similar?
Are store concepts, digital journeys, service rituals and merchandising increasingly convergent?
Illustrative Diagnostic Scale
- 0Strongly Independent
- 1Mostly Independent
- 2Increasingly Correlated
- 3Highly Correlated
Score each dimension from 0 to 3, where 0 means strongly independent and 3 means highly correlated. Track the score over time rather than using a single absolute threshold.
It is not a validated statistical model, econometric measure, financial rating, probability, forecasting model, investment recommendation or empirically calibrated scoring system. It does not calculate a current LVMH score or fabricate historical thresholds.
The managerial trigger is straightforward:
If visible correlation rises for two or more consecutive periods while desirability indicators weaken, stop adding customer-facing synergies and return more decisions to the brand level.
“Desirability indicators” could include organic branded search, full-price sell-through, repeat-client behavior, wait-list strength, direct customer traffic or category-specific market share, depending on the business. Public outsiders could approximate the same test using pricing, campaign timing, product launches, search interest and store formats.
Why does this matter? Because consumers do not need to know that a conglomerate has centralized too much. They only need to begin feeling that several brands are becoming variations of the same commercial machine.
That makes correlation a potentially earlier warning signal than falling revenue.
Limitations, Conclusion and Research Notes
Limitations / What Could Change This View
The largest limitation is disclosure. LVMH reports financial performance primarily by business group, not by major Maison. Standalone revenue, operating profit and invested capital for Louis Vuitton, Dior, Tiffany and most other individual businesses are unavailable. That prevents a rigorous calculation of Maison-level return on invested capital, internal capital-allocation effectiveness or the economic contribution of specific group synergies. [23]
LVMH also does not publish a detailed governance map showing which decisions are centralized, which are shared and which sit entirely inside individual Maisons. The Visibility Rule is therefore an analytical framework derived from LVMH’s stated principles and observable behavior, not a description of a disclosed corporate manual. [3]
The thesis would need revision if evidence showed that heavily centralized customer-facing processes consistently increased long-term desirability across materially different luxury brands, or if Maison autonomy proved largely symbolic rather than operational. It would also weaken if LVMH’s portfolio economics became increasingly dependent on one or two businesses despite continued acquisition and investment across the rest of the group.
Conclusion
LVMH does not solve the tension between scale and luxury by choosing decentralization over centralization. It appears to solve it by making the boundary itself strategic.
The group combines autonomous Maisons with vertical integration, shared capabilities, substantial investment capacity and common institutions for developing expertise. Its €80.8 billion revenue base offers resources few independent luxury houses can replicate, yet the customer still encounters Louis Vuitton, Dior, Tiffany or Sephora rather than a standardized “LVMH product.” [13]
But scale is not automatically diversification. Fashion & Leather Goods generated almost three-quarters of LVMH’s recurring operating profit in 2025, exposing how much the group still depends on the economic strength of its most powerful category. [4]
The strategic lesson is therefore narrower—and more useful—than “build a portfolio of brands”:
“Centralize what makes each business stronger. Do not centralize what makes each business different.”
And when managers are unsure whether they have crossed the boundary, they should not look first at the organization chart.
They should look at the brands.
“When different brands begin moving together in ways customers can see, the machinery of scale may have become too visible.”
Primary references and source hierarchy
The financial conclusions in this article prioritize company filings and official results over secondary estimates. Bain is used for market context rather than company financial data. [24]
Exact data extraction and verification method
Step A — Group trend. For each calendar year from 2019 through 2025, extract LVMH’s reported revenue and “profit from recurring operations” from the corresponding annual-results release. Convert millions of euros to billions where necessary. Calculate recurring operating margin as profit from recurring operations ÷ revenue × 100. No third-party estimates are used in Figure 1. [7]
Step B — Segment economics. From the FY2025 release, extract revenue and recurring operating profit for all five operating business groups plus “Other activities and eliminations.” Calculate each revenue share as segment revenue ÷ €80,807m and each profit share as segment recurring operating profit ÷ €17,755m. Do not exclude the negative Other/eliminations result, because doing so would inflate comparability. [4]
Step C — Peer comparison. Use the latest full fiscal year available by August 30, 2026: FY2025 for LVMH, Kering and Hermès; the year ended March 31, 2026 for Richemont. Use each company’s own operating measure and clearly disclose that Richemont’s fiscal calendar differs. [25]
Step D — Concentration proxies. For LVMH, calculate Fashion & Leather Goods as a percentage of group revenue and recurring operating profit. For Kering, divide Gucci’s disclosed €6.0 billion revenue by Kering’s €14.675 billion group revenue. For Richemont, divide Jewellery Maisons’ €16.5 billion sales by €22.42 billion group sales. Do not manufacture a percentage for Hermès because it does not provide a directly comparable flagship-brand disclosure. [26]
Step E — Case evidence. Use only statements that can be traced to LVMH disclosures for Tiffany and Sephora. Do not infer undisclosed Tiffany revenue, profit, acquisition synergies or return on invested capital. [27]
Unavailable public data: Maison-level operating profit for Louis Vuitton, Dior and Tiffany; a full Maison-level capital-allocation schedule; a formal LVMH centralized-versus-decentralized decision-rights matrix; directly comparable brand-concentration measures across all four peer groups; and enough standalone Tiffany financial data after acquisition to isolate acquisition causality. Any claim requiring those data would exceed what public evidence can support. [28]
Chart files
- Download Figure 1A — LVMH revenue and recurring operating profit, 2019–2025
- Download Figure 1B — LVMH recurring operating margin, 2019–2025
- Download Figure 2 — LVMH 2025 segment revenue share vs recurring operating profit share
- Download Figure 3 — Luxury peer scale vs operating margin
- [1]
File:Louis Vuitton, Champs-Elysées.jpg - Wikimedia Commons — Source ↗
- [2, 3, 5, 12, 13, 22]
Our model — Source ↗
- [4, 11]
Solid performance in a disrupted global economic a... - LVMH — Source ↗
- [6, 23, 24, 28]
Key figures — Source ↗
- [7, 8]
Record Results for LVMH in 2019 — Source ↗
- [9]
Luxury in Transition: Securing Future Growth — Source ↗
- [10]
Accelerating growth in the second quarter - Solid .. ... — Source ↗
- [14]
New records for LVMH in 2021 — Source ↗
- [15]
Sephora — Source ↗
- [16]
LVMH showed good resilience against the pandemic c... — Source ↗
- [17, 25]
Group and Brands' key figures | Kering — Source ↗
- [18]
New record year for LVMH in 2022 — Source ↗
- [19, 27]
Watches & Jewelry - Letter To Shareholders - March 2022 — Source ↗
- [20]
Chiffres clés | Hermès Finance — Source ↗
- [21]
Finding a New Longevity for Luxury — Source ↗
- [26]
2025 results: sequential improvement, unlocking the next ... — Source ↗
Revision history
Version 1.0
Initial publication. Financial dataset updated through FY2025 and operating context through LVMH H1 2026. Introduced the FU Visibility Rule and Correlation Warning.
- Version
- 1.0